
Overview
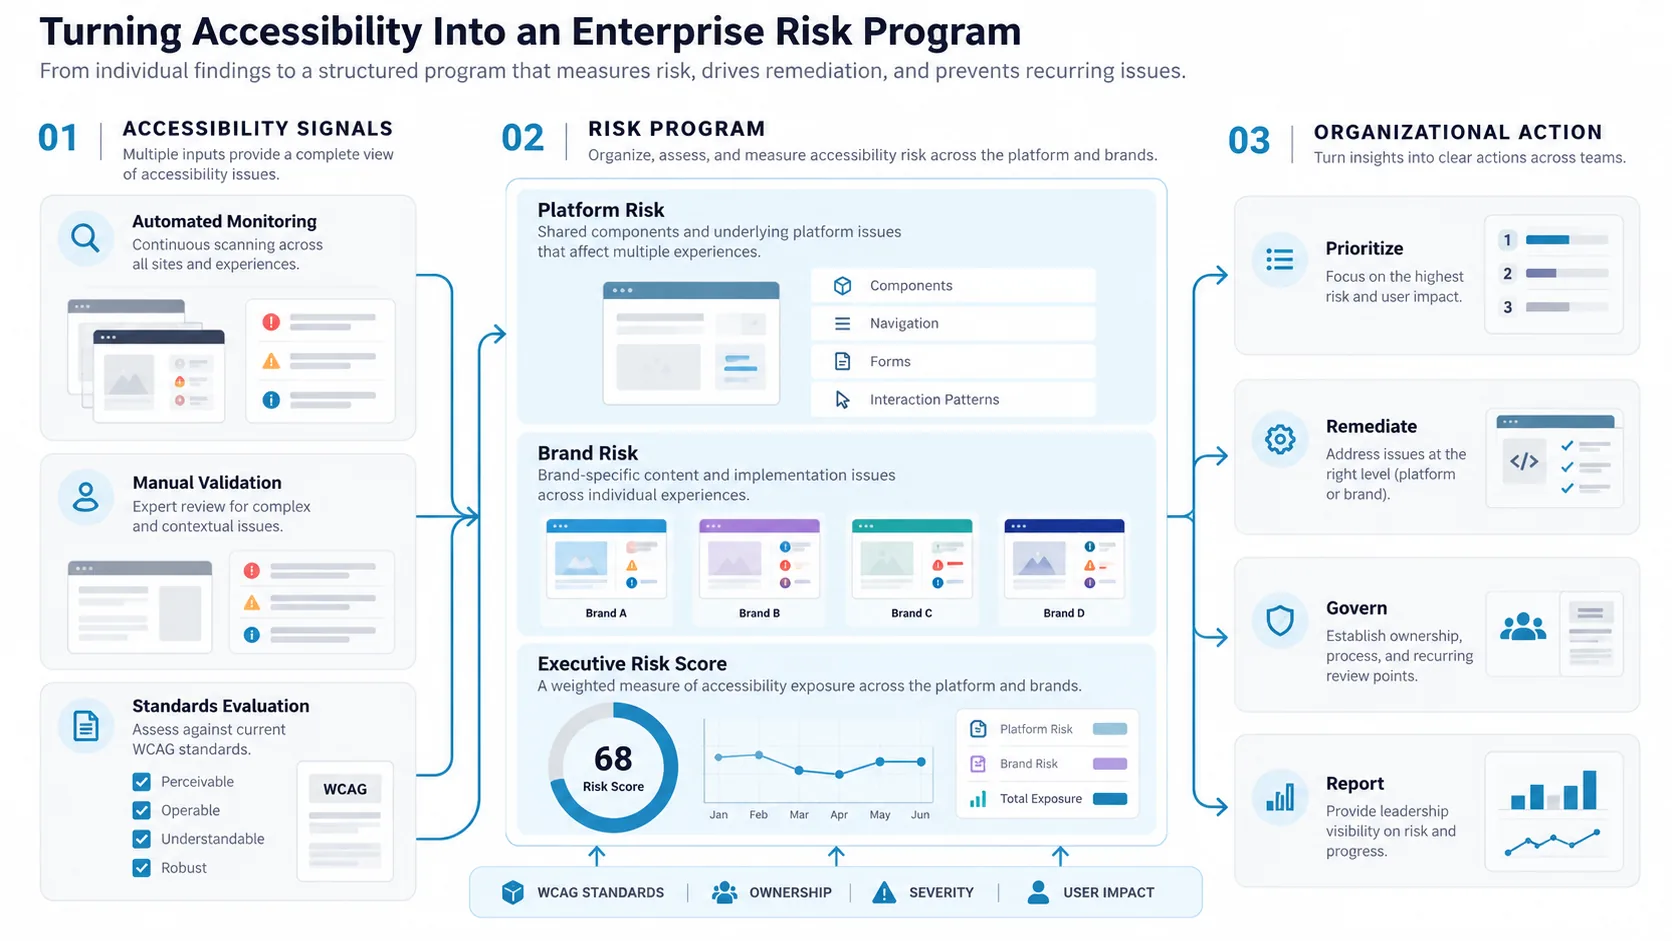
Accessibility programs often begin as defect-management exercises within teams. An audit identifies violations. Tickets are created. Teams remediate the issues they can address. Another assessment happens later, and the cycle starts again.
That process can improve individual pages, but it does not necessarily tell an organization whether accessibility risk is increasing, decreasing, or simply moving somewhere else.
I wanted to treat accessibility differently: as an ongoing product-quality and enterprise-risk concern that could be measured across a shared platform while still preserving visibility into individual brands and experiences.
The challenge
The challenge was not simply finding accessibility violations. Modern accessibility tools already provide teams with large quantities of findings.
The harder problem was understanding what those findings meant collectively across the platform.
When violations live across separate audit reports, product backlogs and development teams, it becomes difficult to compare exposure, determine remediation priority, identify recurring platform issues, or explain overall risk to leadership.
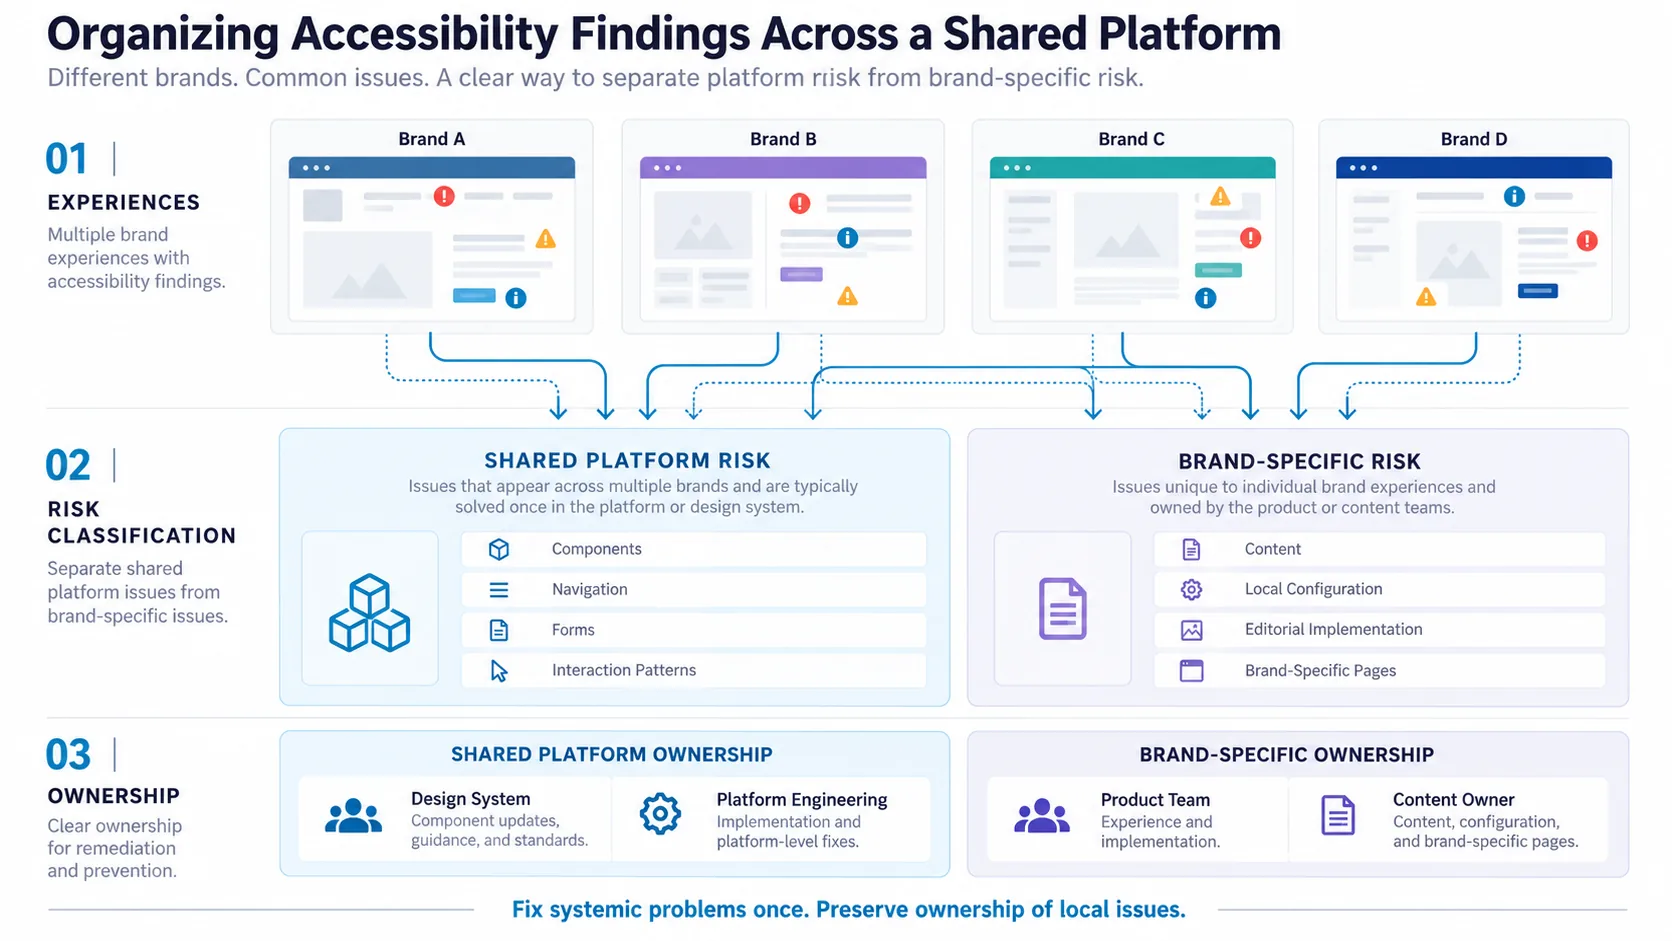
The same accessibility issue might appear repeatedly across multiple brands because of one shared component. Another issue might exist only because of brand-specific content or implementation. Those are materially different problems and should not be managed as though they are identical.
My role
My role was to establish the program and process direction while working with product owners, engineering leads, and the organization’s accessibility center of excellence.
The goal was to move accessibility away from periodic remediation projects and toward a repeatable operating model.
Key decisions
Decision 01
Measure risk at two levels: platform and brand
We began structuring accessibility monitoring at two levels: the underlying platform and the individual brand or experience. This created a clearer distinction between systemic defects that should be corrected once upstream and localized issues that required individual ownership.
Correct systemic defects once upstream; keep clear ownership of local issues.
Decision 02
Build a repeatable, validated assessment model
We centered the program around standards-based evaluation, violation severity, user impact, clear ownership, and recurring review points across monthly and quarterly planning cycles. Accessibility tooling provided continuous evidence, but tooling alone was not the strategy. The assessment method also had to be validated so teams understood what the tool was measuring, where manual review was still required, and how findings should influence prioritization.
A dashboard should support judgment, not replace it.
Decision 03
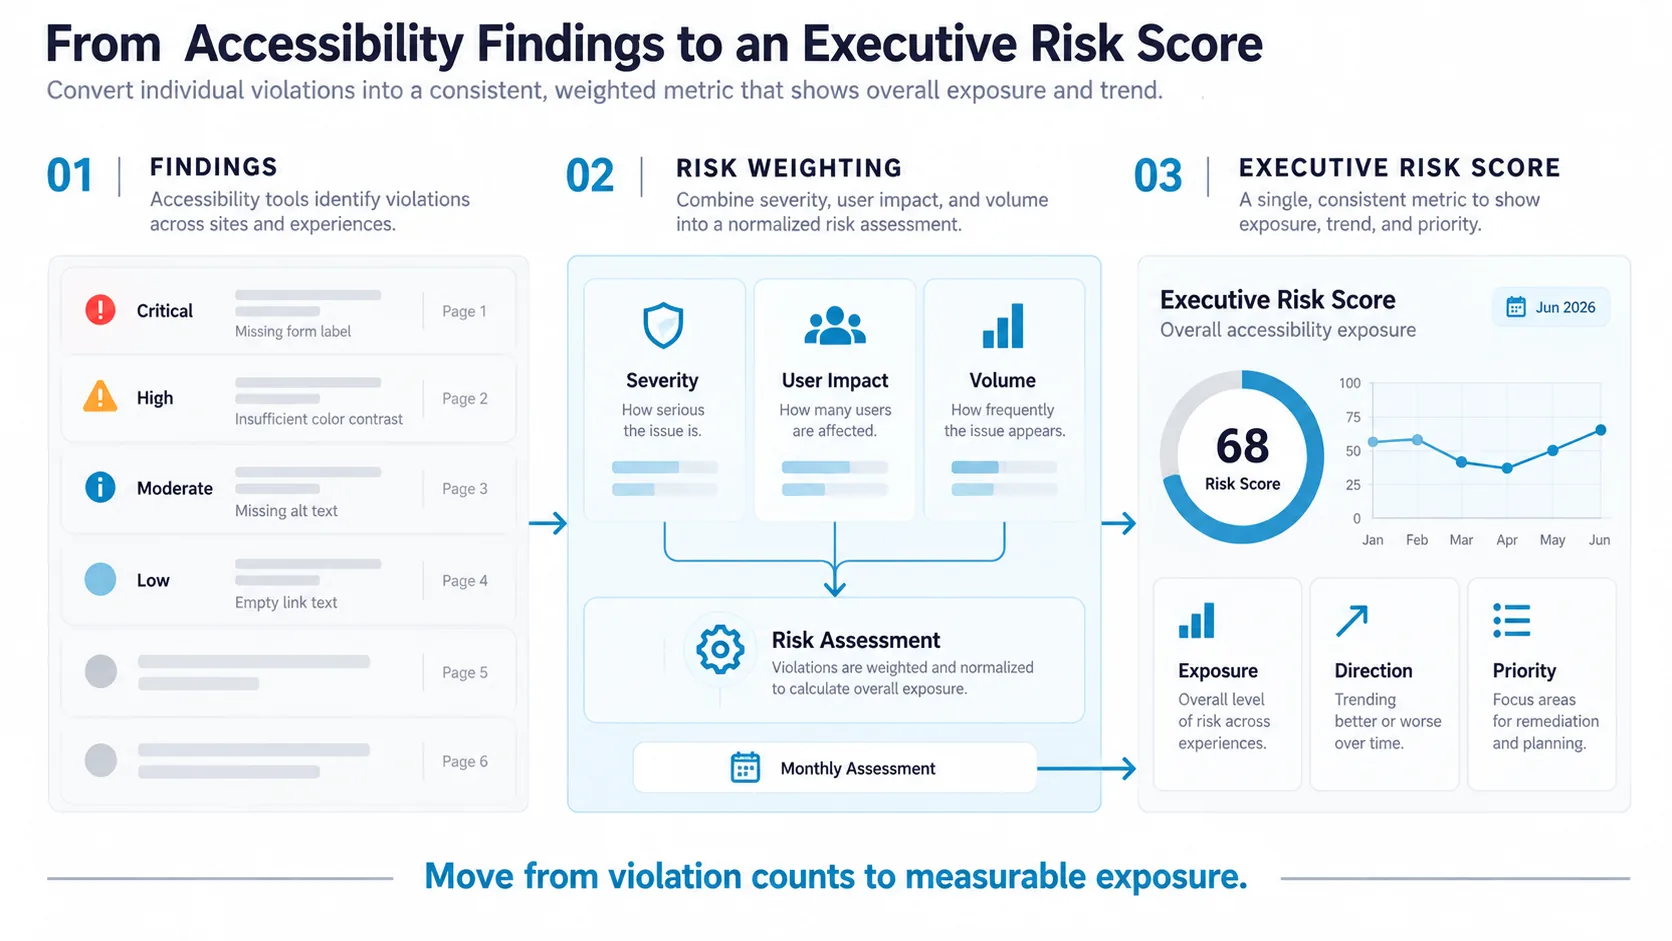
Replace raw counts with an Executive Risk Score
Raw violation counts are limited. Ten high-risk failures can represent greater exposure than hundreds of low-impact findings. Counts can also increase simply because an organization expands testing coverage. We created an Executive Risk Score that numerically weighted accessibility violations based on their assigned risk level and recalculated the score each month.
Not a perfect accessibility number — a consistent indicator that could reveal direction.
Decision 04
Prevent risk through the design system
Remediation cannot be the only accessibility strategy. We also pushed accessibility requirements upstream into the design system so recurring failures could be addressed before they reached production.
Address recurring failures before they reach production.
The solution
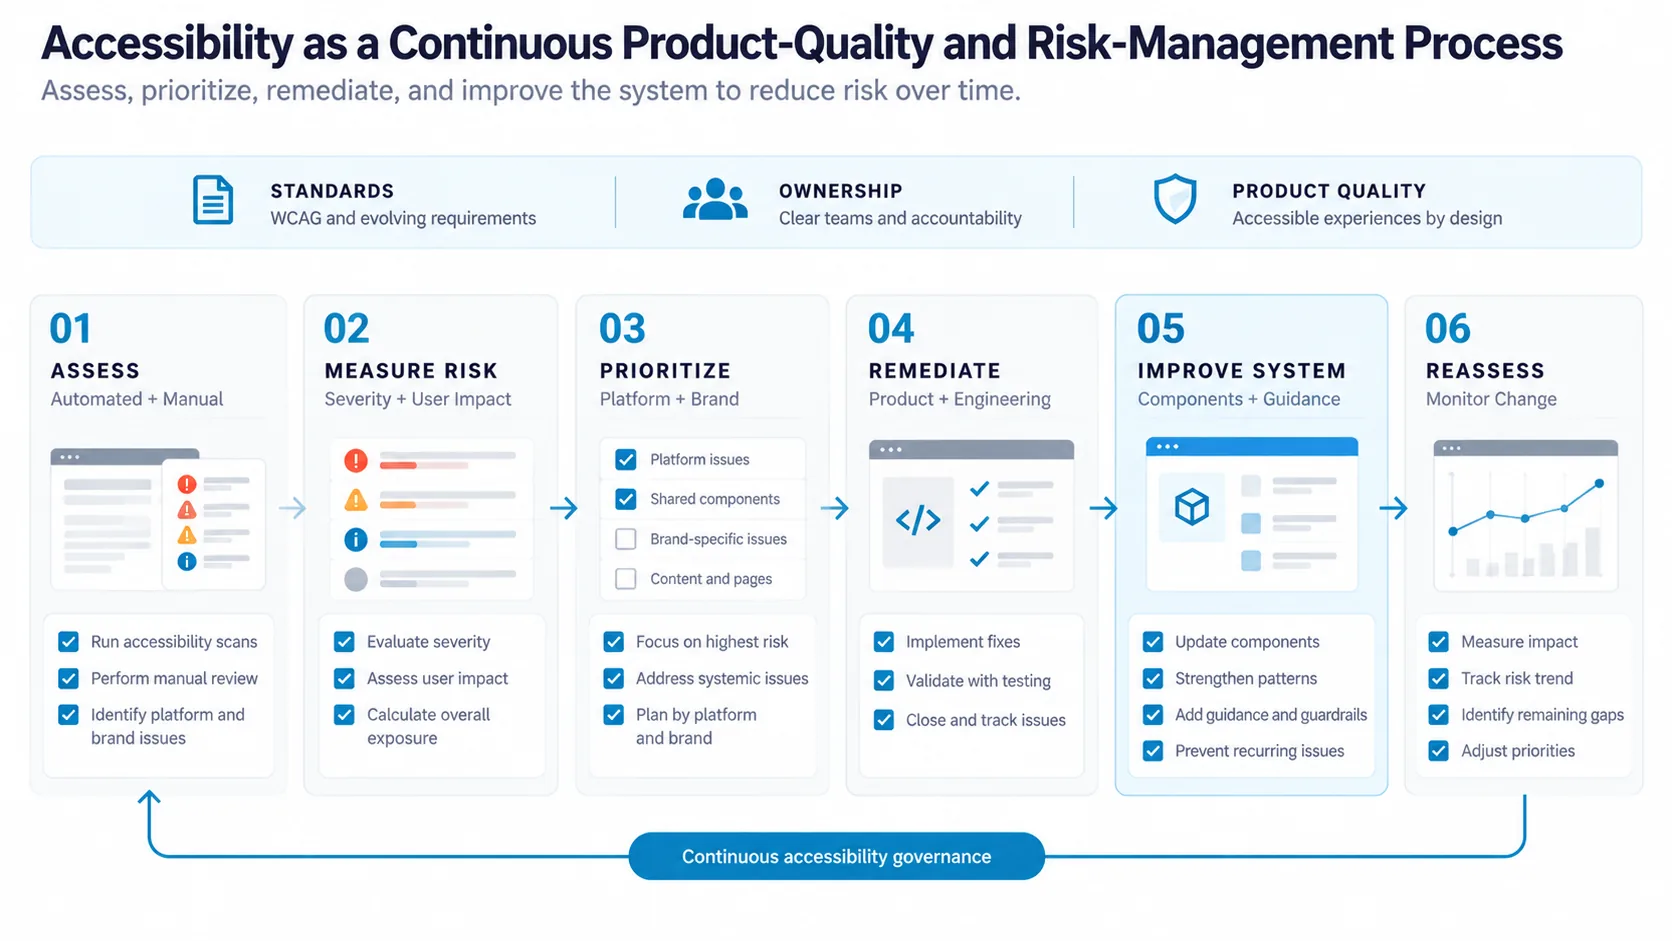
Shared components, states, interaction patterns, and accessibility guidance gave teams a stronger baseline. Designers could also identify where accessibility requirements were not yet covered by the system rather than discovering those gaps only after implementation.
The operating model became a loop:
That changed accessibility from a collection of defects into an organizational feedback mechanism.
Impact
One of the most important changes was translating technical findings into a metric leadership could use. Leadership could now see whether risk was trending upward or downward, compare areas of the platform, and connect remediation discussions to measurable exposure rather than isolated ticket counts.
This also created a foundation for broader reporting as accessibility obligations and standards continue to expand across domestic and international markets.
The larger shift was not the dashboard or the tooling. It was creating a common way for design, engineering, product, accessibility specialists, and leadership to discuss the same risk.
Accessibility became something we could continuously measure, prioritize, prevent, and govern rather than periodically rediscover.
Because of confidentiality requirements, this case study cannot show the actual design system, brand identities, or proprietary implementation details. Impact metrics have also been omitted, so the examples focus on the strategy, architecture, operating model, and design decisions behind the work.